
A standard 10 year chart of UVXY tells quite the story. Change the display to logarithmic and the story changes.
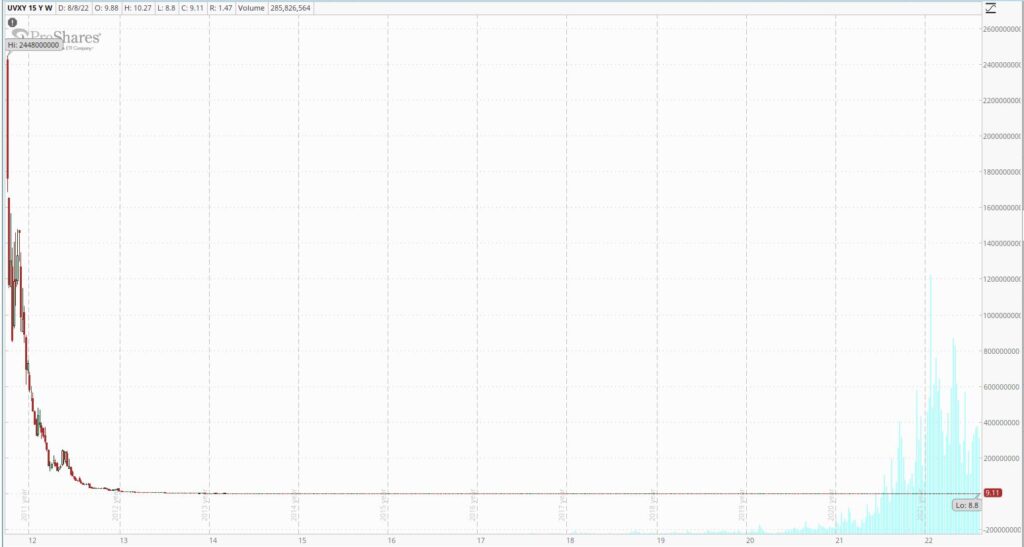
Standard charts display changes in terms absolute values. If you start with a $100,000 short in UVXY in 2011, this standard chart would show you your profit and loss from that initial trade. Notice that relative variance in your position quickly drops to nothing. It also seems, on the surface, that most of the big moves were in the past, with massive drops and massive spikes. Recent moves seem sedate in comparison.
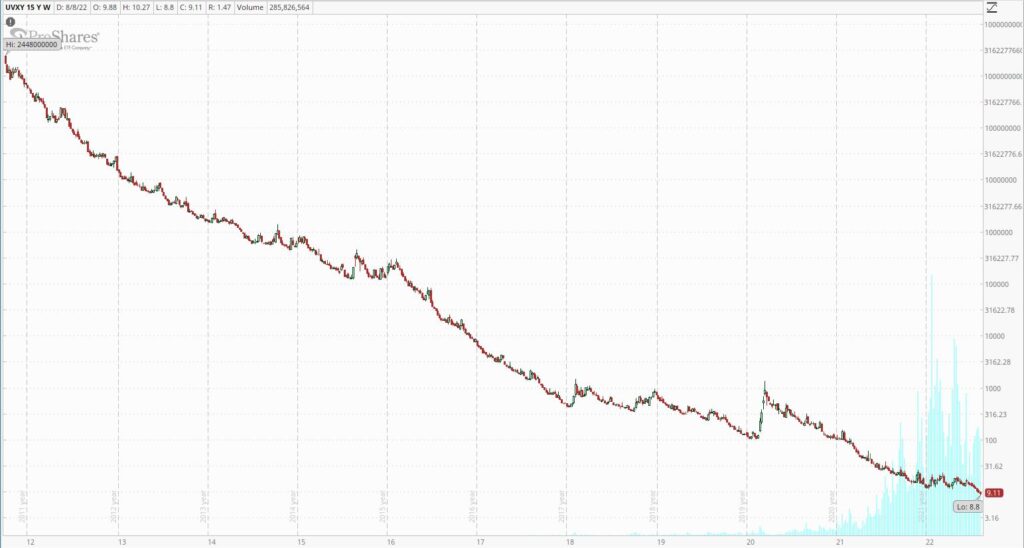
Log style charts can provide a different perspective that might be more useful for active trading. First understand what a setting your chart to log style does. Standard (also known as linear or arithmetic) chart use dollar values on the vertical, or y-axis with no regard to percentage change. Logarithmic charts use percentage moves on the y-axis so that subsequent moves of the same percentage size appear the same distance on the chart.
UVXY’s log style chart reveals a relentless downward march, interrupted by brief spikes higher. A trader will quickly appreciate its downside design bias and rarity of significant spikes by comparison. Log style charts can lose their utility with shorter timespans as they no longer differ in view. For me, UVXY log style charts don’t offer much difference with timeframes less than 6 months